 Skip to content
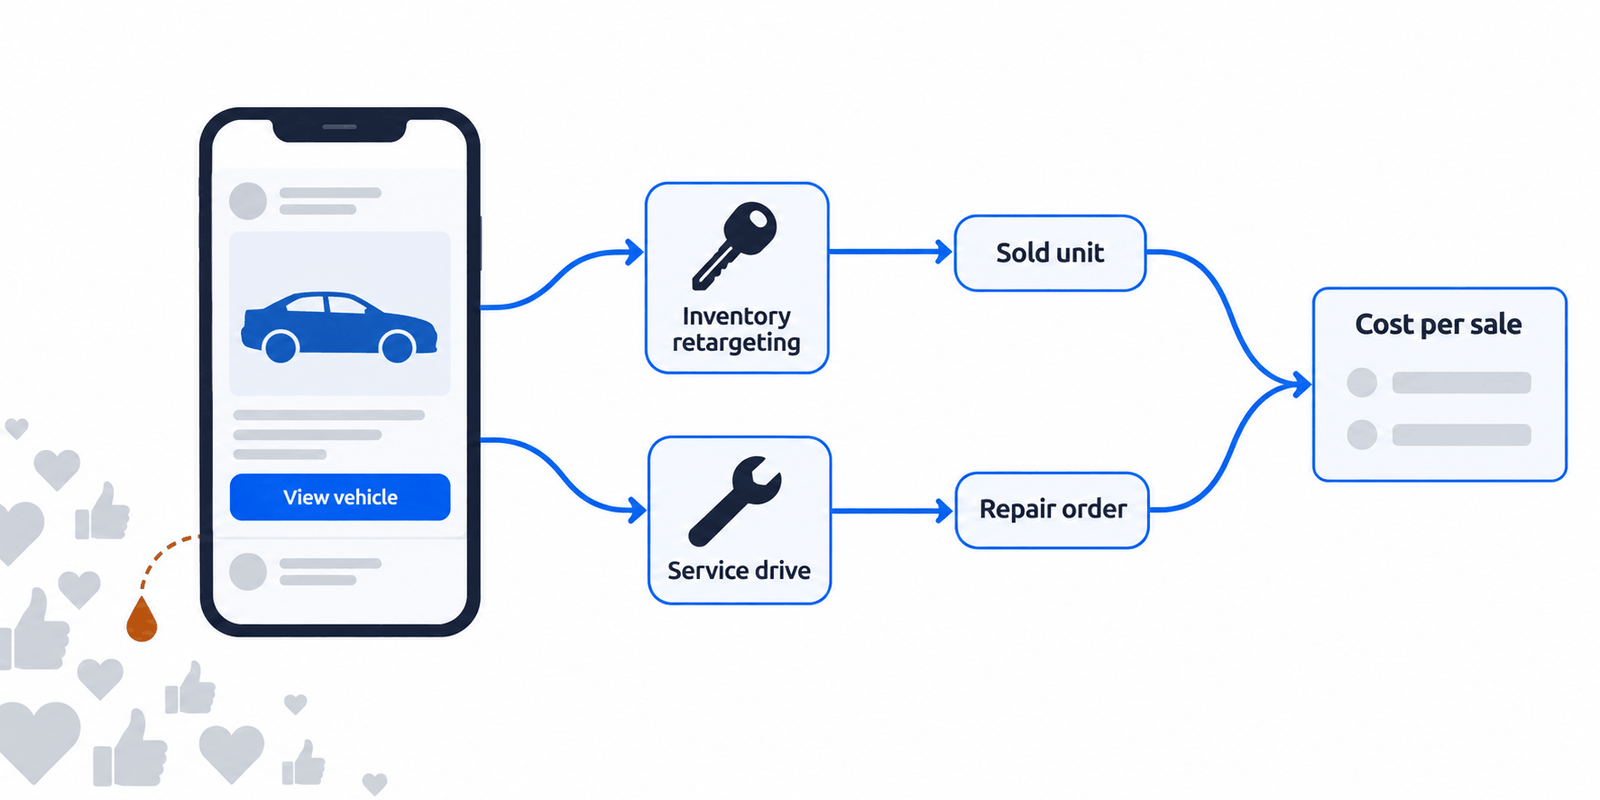
The biggest problem with Meta ads for dealerships is proving they actually sell cars. Your shoppers are on Facebook, but the sale happens on your showroom floor, where Meta can’t see it. Cox Automotive found that 53% of buyers completed every step at the dealership.
So the dashboard shows likes and form fills, and the budget either gets cut or keeps running on faith.
In our work, we see the same pattern often. A Meta campaign drives real leads, nobody connects them to sold units, and the budget gets cut the next month.
The way out starts with deciding where Meta sits in your budget, and which spend it should replace.
Where Meta Ads Fit in a Dealership Budget
Paid social (for example, Meta ads) is a channel you meter, size deliberately, and layer on top of a dealership’s owned channels. Cox Automotive’s 2025 Car Buyer Journey Study found 26% of vehicle buyers used social media while shopping.
One shopper, ten touchpoints, one sale Meta never sees
An illustrative 95-day path to buying a car.
Meta ads AI research Other research The sale
- Day 1
Sees an SUV in a Facebook ad - Day 4
Asks an AI assistant for SUV picks - Day 9
Compares prices on a listing site - Day 15
Searches your store, reads reviews - Day 22
Opens the SUV’s page on your site - Day 30
Sees the SUV again on Instagram - Day 41
Asks AI if the price is fair - Day 58
Fills out a Meta lead form - Day 70
Gets a call back, books a test drive - Day 95
Buys the SUV in your showroom
Meta touched this sale three times. Unless the sale is matched back from the DMS, Meta gets credit for none of it.
95 days
average time in market
4.6 sites
visited on average
19%
used AI tools in 2025
53%
finished at the dealership
Path is illustrative. Stats from Cox Automotive (2025 Car Buyer Journey Study; July 2025 Autotrader release).
Where vehicle buyers went while shopping, 2025
| Source | All buyers | New-car buyers | Used-car buyers |
|---|---|---|---|
| Third-party sites | 75% | 70% | 77% |
| Dealership sites | 59% | 53% | 60% |
| Search engines | 41% | 41% | 41% |
| Used online retailers | 30% | 18% | 34% |
| Social media | 26% | 28% | 26% |
| Automaker sites | 25% | 33% | 22% |
| AI sites | 12% | 17% | 11% |
Source: Cox Automotive 2025 Car Buyer Journey Study.
AI sites already show up in 12% of buyer journeys, and how car buyers use AI to research vehicles is changing where they land first.
Dealers spend more renting reach on listing sites than on social advertising. NADA Data 2025 shows the average franchised dealership spends about $586,246 a year on advertising, with 20% ($117,249) going to third-party listing sites and 14.2% ($83,247) to social.
A metered Meta line, funded by trimmed marketplace spend, reallocates money you already commit. For how those marketplace invoices actually perform, see what third-party leads really cost.
Where the average dealership ad dollar goes
Average franchised dealership annual ad budget, about $586,246 (NADA Data 2025).
Search engine marketing
$123,698 (21.1%)
Third-party listing sites
$117,249 (20.0%)
SEO / website
$114,318 (19.5%)
Social media advertising
$83,247 (14.2%)
TV
$61,556 (10.5%)
Radio
$40,451 (6.9%)
Direct mail
$32,830 (5.6%)
Newspaper
$12,311 (2.1%)
Other
$586 (0.1%)
Dealers spend more renting reach on third-party listings ($117K) than on the social audiences they own ($83K).
Source: NADA Data 2025, Estimated Advertising Expenditures by Medium (p. 16)
How Automotive Inventory Ads (AIA) Work
Automotive Inventory Ads (AIA) let dealerships run dynamic vehicle ads on Facebook and Instagram.
Here’s how it works:
- A shopper visits a vehicle detail page (VDP) on your website.
- The Meta Pixel records which vehicle they viewed.
- AIA automatically shows that shopper the same vehicle, along with similar inventory.
- The ads update as your inventory changes.
How Automotive Inventory Ads (AIA) work
A live catalog feed and the Meta Pixel turn known shopper intent into the right vehicle in-feed.
A shopper views a vehicle page (VDP) on your site
The Meta Pixel records that intent
AIA serves that exact vehicle, plus similar ones, across Facebook and Instagram
AIA has two main uses:
- Retargeting: Shows vehicles to people who already visited your website or VDPs.
- Prospecting: Shows vehicles to new shoppers who are likely to be interested based on their online behavior.
Retargeting is especially useful because you’re advertising to shoppers who have already shown interest in a specific vehicle. AIA can put the exact vehicle a shopper viewed back in front of them without your team manually creating an ad for every unit.
What an inventory ad looks like to the shopper
Illustrative mockup.
First card. The exact vehicle the shopper viewed on your site, pulled from the catalog feed.
Next cards. Similar units from the same feed, matched on body style, price band, and features.
Every detail comes from the feed. Photo, mileage, and price are only as accurate as your inventory data.
Meta removed vehicle listings from Facebook Business Pages in the U.S. and several other markets in January 2023, while paid vehicle ads remained available.
Why Inventory Feed Quality Drives AIA Results
AIA is only as good as the feed behind it. Meta’s automotive catalog specification requires a vehicle ID, make, model, year, mileage, price, condition, and at least one image for every unit, so gaps in the feed show up directly in the ads.
The same feed can also power Google vehicle ads through Merchant Center, where Google requires the price on your vehicle page to match the feed price.
Four things that quietly kill an AIA feed
A dynamic ad is only as good as the data behind it.
- Stale units
Ads send shoppers to vehicles you already sold. - Stock photos
Generic images read as a listing that is not a real car. - Price mismatches
The feed price disagrees with the vehicle page. - Missing fields
No VIN, trim, mileage, or availability to match on.
Fix it once. Sync the feed at least daily, and one clean feed serves both Meta inventory ads and Google vehicle ads.
Here are a few ways to keep the feed clean.
- Refresh the feed at least daily: Meta’s scheduled feeds can pull your inventory file hourly, daily, or weekly. Hourly works well for lots that turn units fast.
- Connect sold status to the feed: When a deal closes in the DMS, the unit should leave the catalog that day.
- Hold units until real photos exist: Keep a vehicle out of the feed until you take photos on your lot.
- Publish one price everywhere: The feed, the VDP, and the ad should show the same number, including every dealer-required fee. In March 2026, the FTC warned 97 dealer groups that advertised prices must include all mandatory fees other than government charges.
- Spot-check weekly: Pull ten random units and compare the feed, the VDP, and the car on the lot. Fix any errors Commerce Manager flags on the catalog.
Building a High-Intent Retargeting Campaign Stack
Run retargeting as three stages, each with one job. A shopper moves to the next stage only after they take the action in the stage before it.
| Stage | Who sees it | Ad | Ask |
|---|---|---|---|
| Remind | Viewed a VDP in the last 7 days | AIA carousel of that unit plus similar ones | View the vehicle again |
| Capture | Viewed 2+ VDPs or clicked a Stage 1 ad | Single vehicle with lead form | Check availability |
| Convert | Sent a lead or started a chat | Test-drive or appraisal offer | Book a time |
Two audience rules run behind every stage:
- Exclude buyers. Upload your DMS sold list weekly and exclude it, so you stop paying to show cars to people who already bought one.
- Expand from buyers. Use the same sold list as the seed for a lookalike audience, so prospecting starts from people who look like real customers.
Pew’s 2025 data shows 58% of 30- to 49-year-olds use Facebook daily, so a Stage 1 audience is reachable within days.
Customer-list uploads must follow Meta’s customer-data terms and applicable privacy law. For how to build these lists, see first-party audiences from your DMS and CRM. [COMPLIANCE]
How to Run Service Department Facebook Ads
Service helps dealers win back customers they already have. Cox Automotive estimates that each lost service customer may cost a dealer $12K or more in service spend over the ownership period. Dealers’ share of service visits also fell from 33% in 2018 to 29% in 2025.
An aging U.S. vehicle fleet makes service even more important. The average U.S. light vehicle was 12.8 years old in 2025, so owners need more maintenance as vehicles age.
Build four customer-list audiences from your service records, and give each one a single offer.
| Audience | DMS rule | Offer | Button |
|---|---|---|---|
| New buyers, no first service | Bought in the last 90 days, no appointment on file | Book your first service | Book service |
| Due for maintenance | Last repair order outside the normal interval | Seasonal or maintenance offer | Book service |
| Lapsed customers | No repair order in 12 months or more | Win-back offer, such as a discounted inspection | Book service |
| Trade-in candidates | Older or high-mileage vehicles | Appraisal offer tied to the next visit | Get offer |
The first audience has the clearest case. Cox found 80% of new buyers want to service where they bought, but only 30% leave with that first appointment booked.
You don’t need a huge budget. Start with your first-party service audiences from the DMS and CRM, then promote timely service offers to the right customers. Upload these lists only as Meta’s customer-data terms and applicable privacy law allow, and check consent flags first. [COMPLIANCE]
Service also feeds the next sale. Cox found that 74% of buyers who keep servicing with their dealer say they are likely to buy their next vehicle there, compared with 44% of those who don’t.
33% of service customers are highly interested in a trade-in, yet only 14% are offered a trade-in value during a service visit. Service ads can bring customers back into the dealership, and the trade-in conversation can follow when the timing makes sense.
Keep your service customers coming back, and you have a better chance of keeping them when they’re ready for their next vehicle.
The fixed-ops lane competitors ignore
Dealers are losing service share while every lost customer carries a five-figure tail.
$12,398
Lifetime service spend lost with every service customer who leaves
33% → 29%
Dealer share of all service visits, 2018 to 2025
68% → 55%
Dealer share for vehicles under two years old, 2018 to 2025
Source: Cox Automotive 2026 Fixed Ops and Ownership Study
Where Meta Ads for Dealerships Waste Budget
Most wasted spend traces to four habits.
- Boosting for engagement: A boost pays for likes, comments, and reach, and none of those tie to a VIN or a sold unit. In our work, the most common waste is years of boosted lot photos that felt like marketing because likes kept coming while sales stayed flat.
- Editing during the learning phase: Meta says ad sets usually exit learning after about 50 optimization events, and significant edits restart it. Frequent changes keep results unstable.
- Broad prospecting at dealership prices: Most of a cold audience is not shopping right now. Cox Automotive’s 2026 Fixed Ops study found 61% of owners keep their vehicles five years or more, and 74% of near-term shoppers plan to delay their purchase. Retargeting spends on people who already showed intent.
- Lead forms without a response SLA: Pied Piper’s 2026 study of 3,290 dealership websites found 14% of dealers still failed to personally respond to a web inquiry, and only 51% gave a fast, complete response by email, text, and phone.
How to Measure Meta Ads by Cost Per Sale
Judge Meta the same way you judge every other channel, by cost per sale. Divide what you spent on a channel by the cars it helped sell. For service campaigns, divide by completed repair orders.
The hard part is the bottom of that fraction, because most sales still close in person where Meta cannot see them. Here’s what will fix that:
- Record the source of every lead: Connect Meta lead forms to your CRM through a direct integration or a connector like Zapier, and add tracking tags (UTM parameters) to every ad link, so each Meta lead lands in the CRM labeled as Meta.
- Credit sales in your CRM with one lookback period: Each month, match your DMS sold list to CRM leads and credit each sale to the lead’s source. Use the same lookback for every channel. Ninety days is a sensible start, since Cox data shows the average buyer spends 95 days in the market.
- Send closed deals back to Meta: Send each sale daily through Meta’s Conversions API. Meta only credits sales inside its attribution windows, so treat its number as a floor. A CRM integration or data partner can handle the connection.
- Put every channel in one table. Divide each channel’s spend by its credited sold units, and service spend by completed repair orders. Review the table monthly and move the budget toward the lowest cost per sale.
Here is how the math works for one store in one month (illustrative example):
| Channel | Monthly spend | Credited results | Cost per result |
|---|---|---|---|
| Meta inventory ads | $3,000 | 8 sold units | $375 per sale |
| Listing sites | $9,800 | 22 sold units | $445 per sale |
| Meta service-drive ads | $1,200 | 46 repair orders | $26 per repair order |
In this example, Meta sells cars for less than the listing sites. Your own table is the one that counts.
Both numbers undercount. CRM credit misses buyers who never submit a lead, and Meta’s report misses sales outside its attribution windows. That gap varies by channel. In a Perficient study of 875,000 sales for Autotrader, 92% of marketplace-assisted buyers never submitted a lead. Read every row as a floor, and keep that uneven gap in mind before you move budget.
Find Where Your Meta Spend Leaks
Not sure if your Meta budget is selling cars? Book a 30-minute founder call, no sales scripts. We will review your inventory feed, your retargeting stack, and how your sales get credited, then show you where the spend leaks.
Meta ads for dealerships work best when they bring shoppers into a broader system of channels your business owns. Shoppers visit 4.6 sites on average, and 19% of 2025 buyers used AI tools during their research, so we also offer a free 24-hour AI visibility audit that runs 20 shopper-intent prompts for your makes, city, and competitors.
Meta Ads for Dealerships FAQs
Can used-car dealers run Automotive Inventory Ads?
Used-car dealers can run Automotive Inventory Ads. Meta’s catalog specification includes a field that marks each unit as new, used, or certified pre-owned, and a required mileage field. Independent used-car stores can run the same retargeting stack as franchised dealers.
Can dealership ads mention financing or monthly payments?
Dealership ads can mention financing or monthly payments, but only under extra rules. They must run in Meta’s Financial Products and Services category, which limits targeting. A quoted loan payment must also show the down payment, repayment terms, and APR, and lease payments need their own disclosures. [Compliance]
How long does it take to see results from Meta ads?
Daily numbers usually settle once an ad set exits learning, which Meta says takes about 50 optimization events. Sales take longer, since Cox data shows the average buyer spends 95 days in market. Judge cost per sale over at least 90 days.
Sources
- Cox Automotive. “Cox Automotive Car Buyer Journey Study Finds Efficiency, Digital Tools and AI Drive Record Satisfaction.” Cox Automotive, January 13, 2026. Accessed October 6, 2026.
- Cox Automotive. “2025 Cox Automotive Car Buyer Journey Study: Report Summary.” Cox Automotive, January 2026. Accessed October 1, 2026.
- National Automobile Dealers Association. “NADA Data 2025: Annual Financial Profile of America’s Franchised New-Car Dealerships.” NADA, 2026. Accessed October 6, 2026.
- Meta. “Vehicle and Real Estate Listings from Facebook Business Pages on Marketplace.” Meta Business Help Center. Accessed October 1, 2026.
- Meta. “Automotive Catalog Reference.” Meta for Developers. Accessed October 1, 2026.
- Google. “Vehicle Ads Activation Guide.” Google Merchant Center Help. Accessed October 1, 2026.
- Meta. “Catalog Overview.” Meta for Developers, updated February 27, 2026. Accessed October 6, 2026.
- Federal Trade Commission. “FTC Warns 97 Auto Dealership Groups About Deceptive Pricing.” FTC, March 2026. Accessed October 6, 2026.
- Pew Research Center. “Americans’ Social Media Use 2025.” Pew Research Center, November 20, 2025. Accessed October 1, 2026.
- Cox Automotive. “2026 Fixed Ops and Ownership Study.” Cox Automotive, April 2026. Accessed October 1, 2026.
- S&P Global Mobility. “U.S. Vehicle Age Rises Again to 12.8 Years in 2025.” S&P Global Mobility, May 21, 2025. Accessed October 6, 2026.
- Cox Automotive. “What Dealers Are Leaving in the Service Lane.” Cox Automotive Retail, April 9, 2026. Accessed October 6, 2026.
- Meta. “About the Learning Phase.” Meta Business Help Center. Accessed October 1, 2026.
- Cox Automotive. “Dealerships Capture Record Fixed Ops Revenue, But Lose Market Share as Customers Drift to General Repair.” Cox Automotive, April 9, 2026. Accessed October 1, 2026.
- Pied Piper Management Company. “Infiniti Dealers Rank Highest in 2026 Web Lead Response Study.” Business Wire, February 22, 2026. Accessed October 1, 2026.
- Cox Automotive. “Autotrader Finds Dealers Miss Key Sales and Wasted Ad Budgets with 92% of Vehicle Sales Untraceable.” Cox Automotive, July 9, 2025. Accessed October 1, 2026.
- Meta. “Marketing API Out-of-Cycle Changes, 2025.” Meta for Developers, January 14, 2025. Accessed October 1, 2026.
